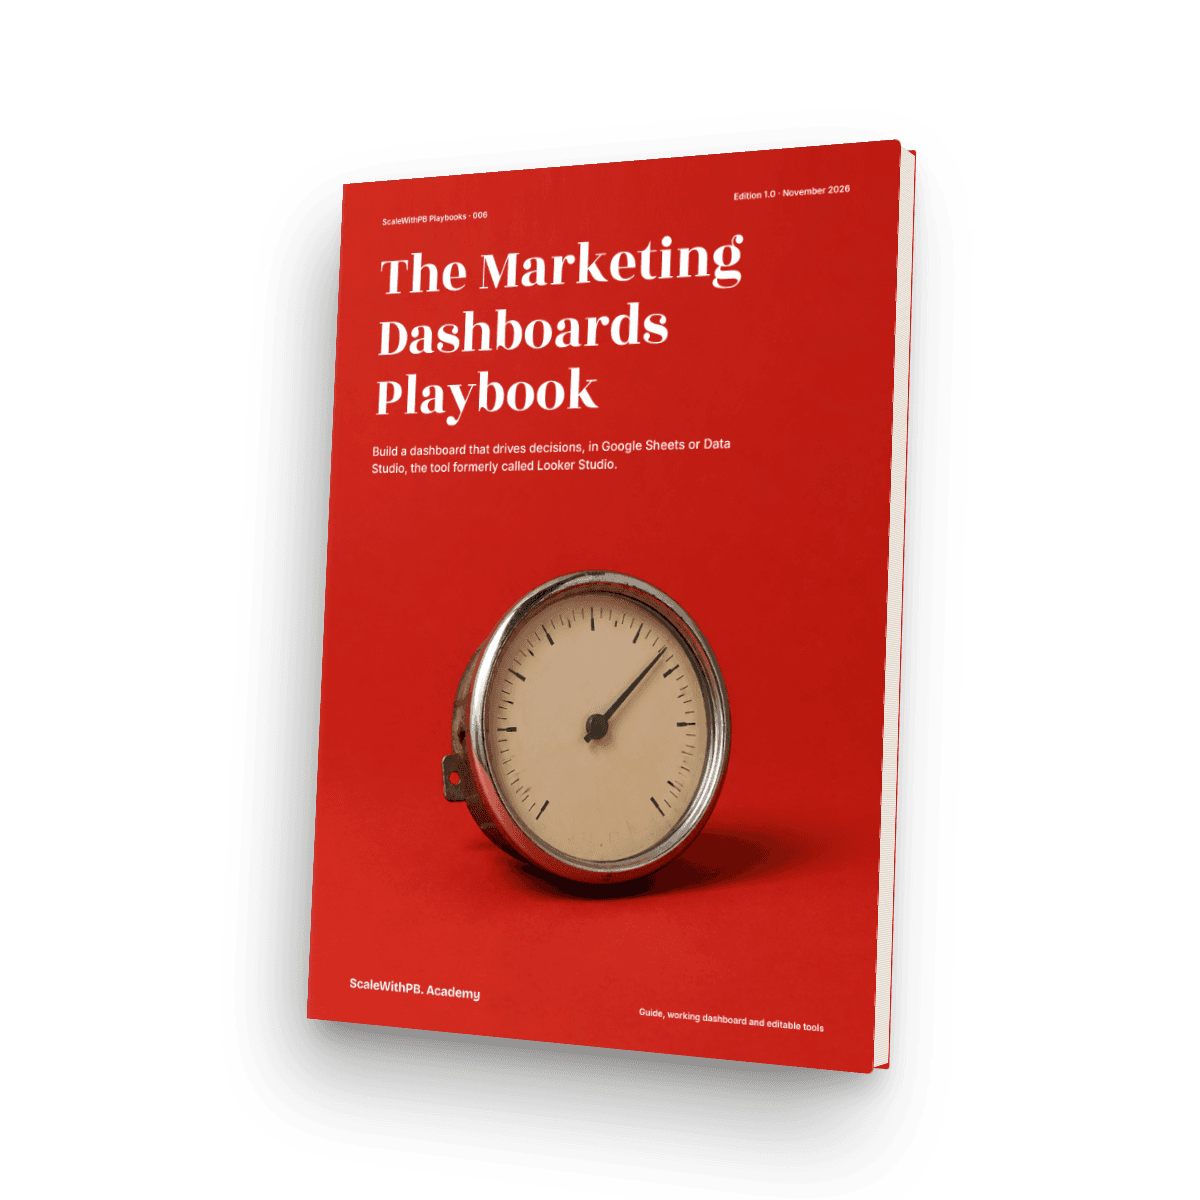
The Marketing Dashboards Playbook
Build one page that drives decisions, in Google Sheets or Data Studio.
A working method and a formula-driven dashboard for marketers, founders and agencies drowning in reports. It builds on delivered money, not platform claims, with COD, RTO and GST inside the numbers. Data Studio is the tool formerly called Looker Studio.
One-time payment. Instant access, and future editions included.
- Also in The Complete Library: 10 books for ₹4,999
- Also in The Client Work Bundle: 3 books for ₹1,999
You don't need more charts. You need a page someone acts on.
Most reports list everything the tools can export. They take hours, nobody agrees on the numbers, and a record month on Ads Manager can still leave less money in the bank. This playbook starts from the decisions your reader has to make, and builds down to the few numbers that support them.
What you'll be able to do
- Choose one top number, and break it into a KPI tree that adds up
- Cut a long report to six KPIs, each with a line, an action and an owner
- Explain why Meta, Google, GA4 and your store never match, and which to use for what
- Join orders, courier status and UTMs into one clean table
- Run a working dashboard in Google Sheets or Excel on your own exports
- Publish a shareable page in Data Studio, without the usual quota and blending traps
- Send a one-page report that gets a decision, even in a bad month
Who it's for
- Marketers. You spend hours on reports, and want them to change what happens next.
- Founders. You want to know what marketing really left in the bank, after RTO and discounts.
- Agencies and freelancers. You need honest client reports that don't take days each month.
Who it's not for
- Anyone wanting a live, automatic connection to their ad accounts. This is a guide with templates, not hosted software, and you paste exports yourself unless you add a connector.
- Large teams on a data warehouse. It doesn't teach SQL or BigQuery modelling.
- Anyone looking for universal benchmarks.
Why it's worth paying for
Decisions first
Every number needs a line, an action and an owner. The workbook turns each KPI into On track, Watch or Act, and keeps a decision log.
Built on delivered money
COD, RTO, discounts and a GST placeholder go into the numbers, so contribution after ads comes from what really arrived.
A reconciliation tab
Six answers for one month, side by side, with which source to use for which question, and a log for gaps you can't yet explain.
A dashboard that really calculates
Seventeen tabs, six native charts and illustrative sample data. Formulas were recalculated by a separate engine before release, and use functions shared by Excel and Google Sheets.
Every claim labelled
Claims are tagged Documented, Practice or Hypothesis, with sources, dates and a list of what we could not verify, including connector prices.
What's included
| Item | What it does | Format |
|---|---|---|
| The guide | 69 pages, A4 PDF, with clickable contents and links | |
| KPI Tree Worksheet | Calculator, lever ranking chart and a lead-generation version | XLSX, PDF page |
| Metric Dictionary | 26 metrics defined, plus what each platform calls the same idea | XLSX, CSV, PDF page |
| Marketing Dashboard | Tiles, decisions, campaigns, channels, reconciliation, checks, and six native charts, with sample data | XLSX, CSV |
| Data Cleaning Checklist | 23 checks, plus practice sheets for UTMs, dates, money and line items | XLSX, CSV, PDF page |
| Client Report Template | One A4 page that writes its own headline | XLSX, PDF page |
| 30-Day Dashboard Plan | One task a day, with dates that fill in | XLSX, CSV, PDF page |
| AI Prompt Pack | 12 prompts for audits, definitions, mismatches and reports | PDF, TXT |
See inside
Real pages from the guide.
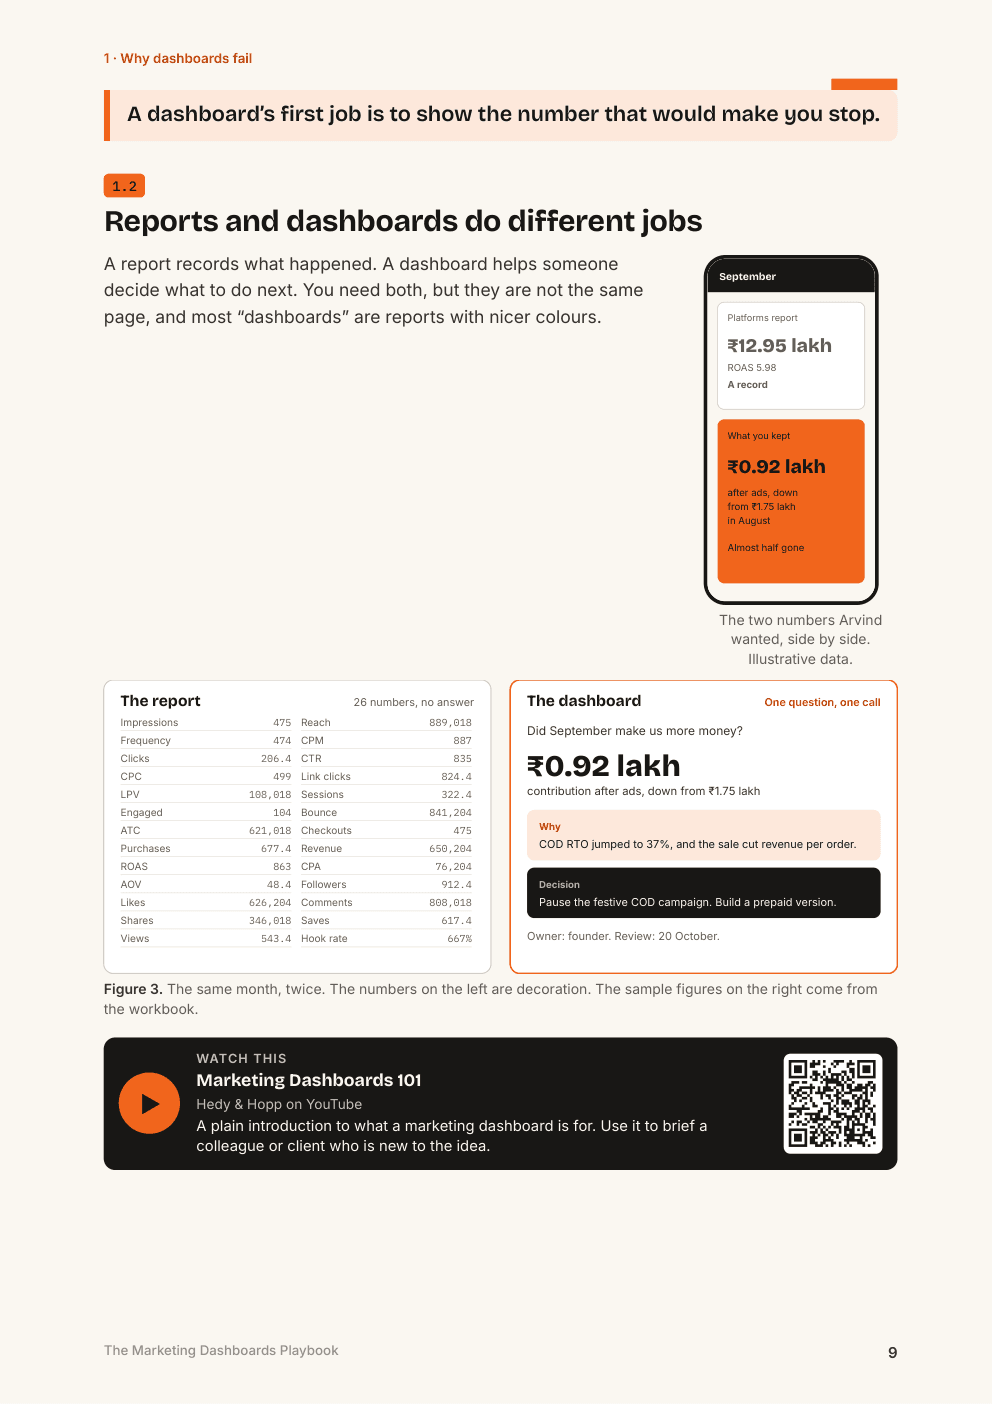
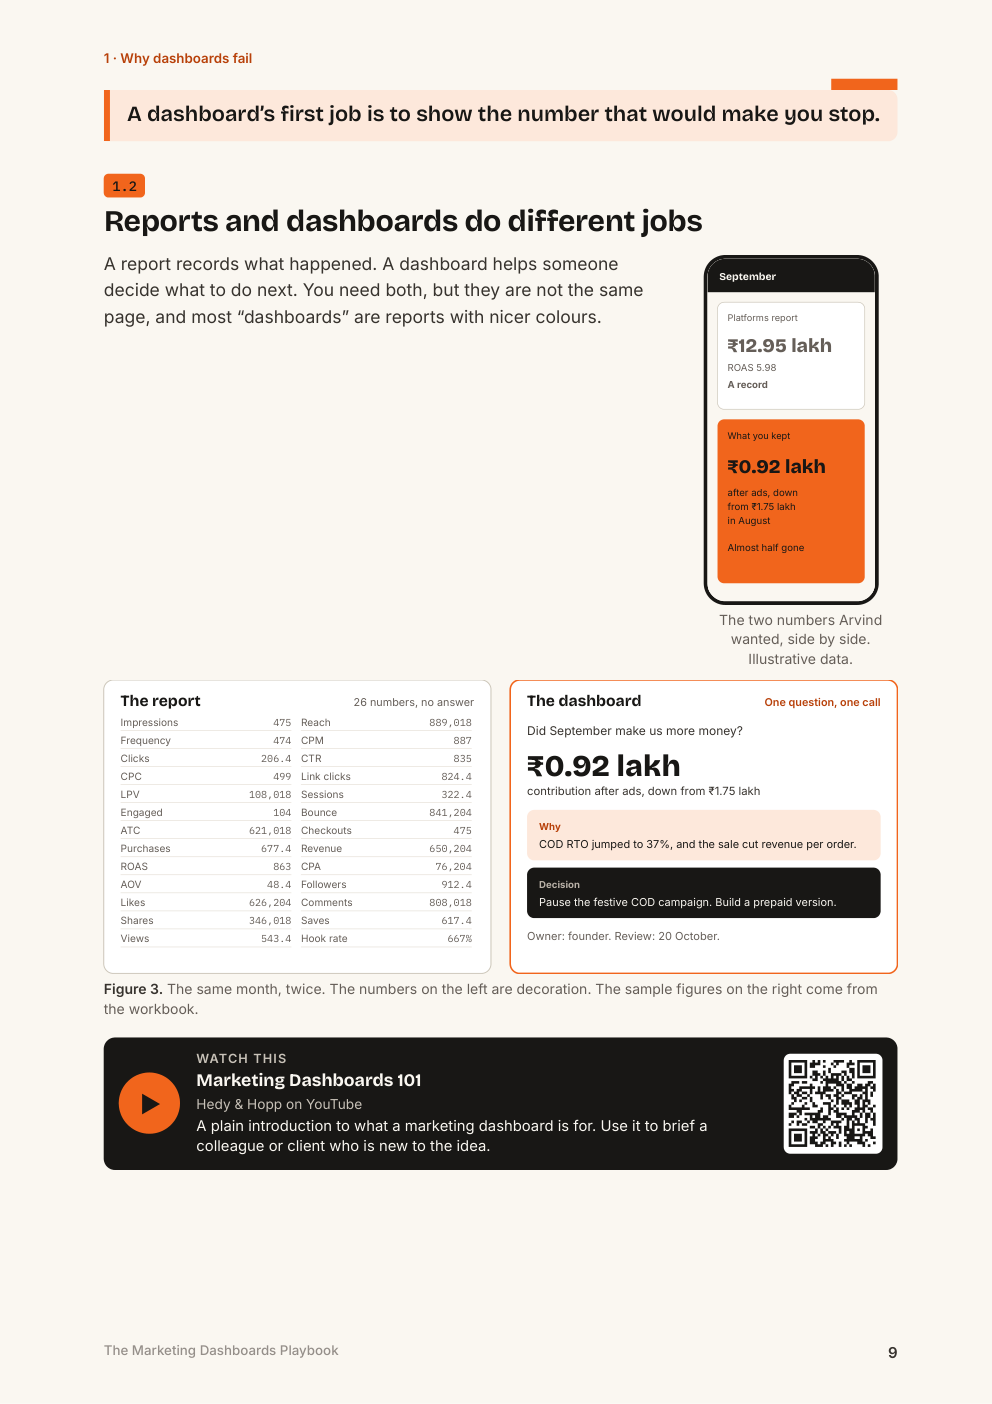
A report and a dashboard, for the same month
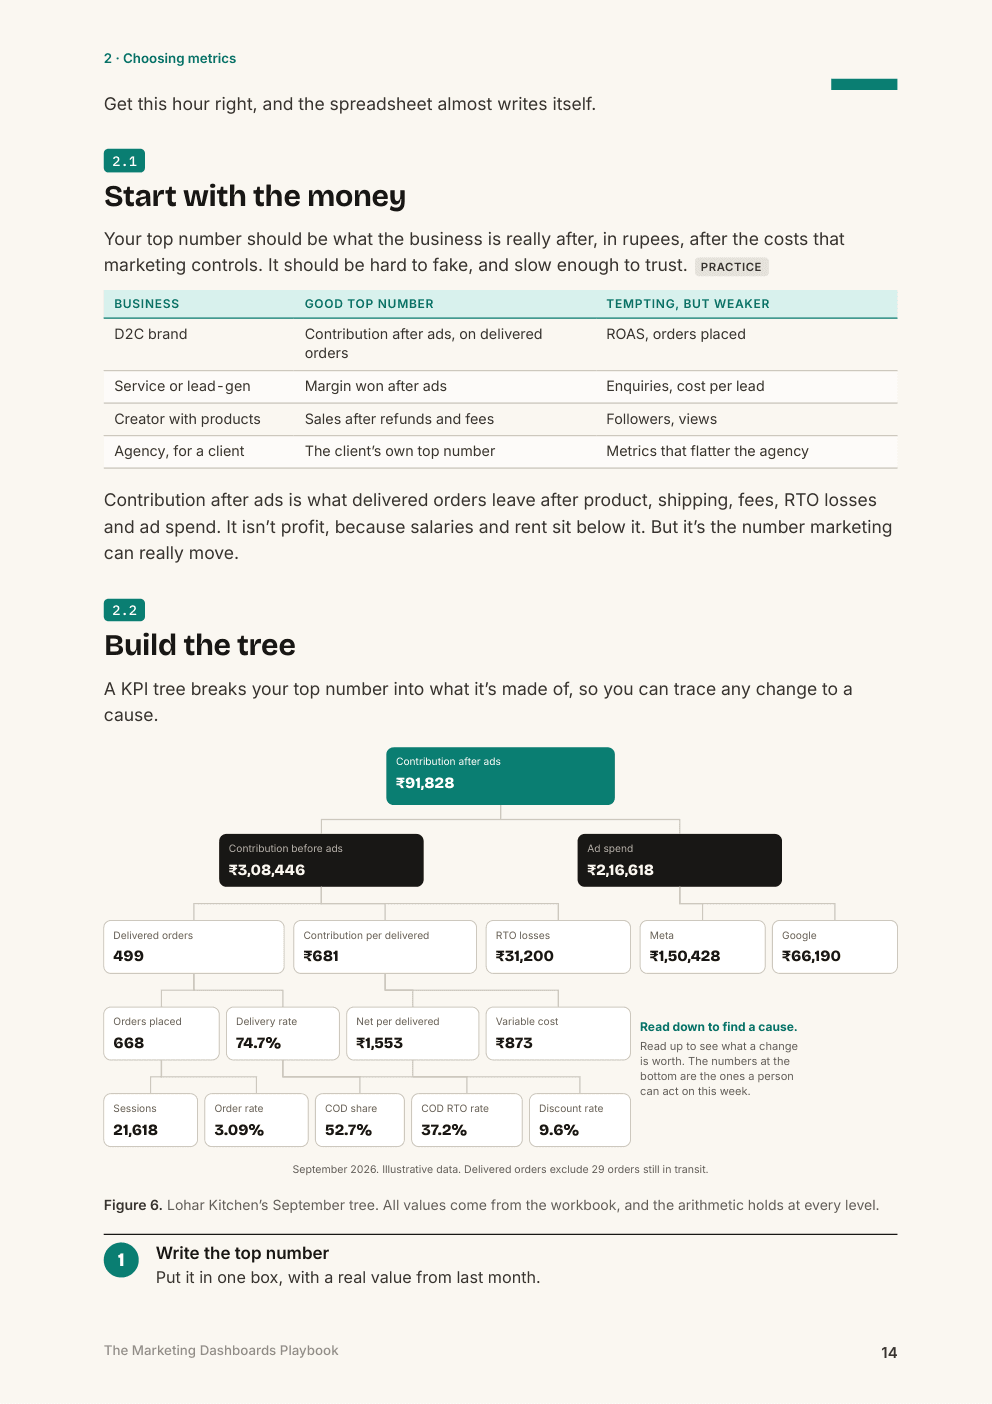
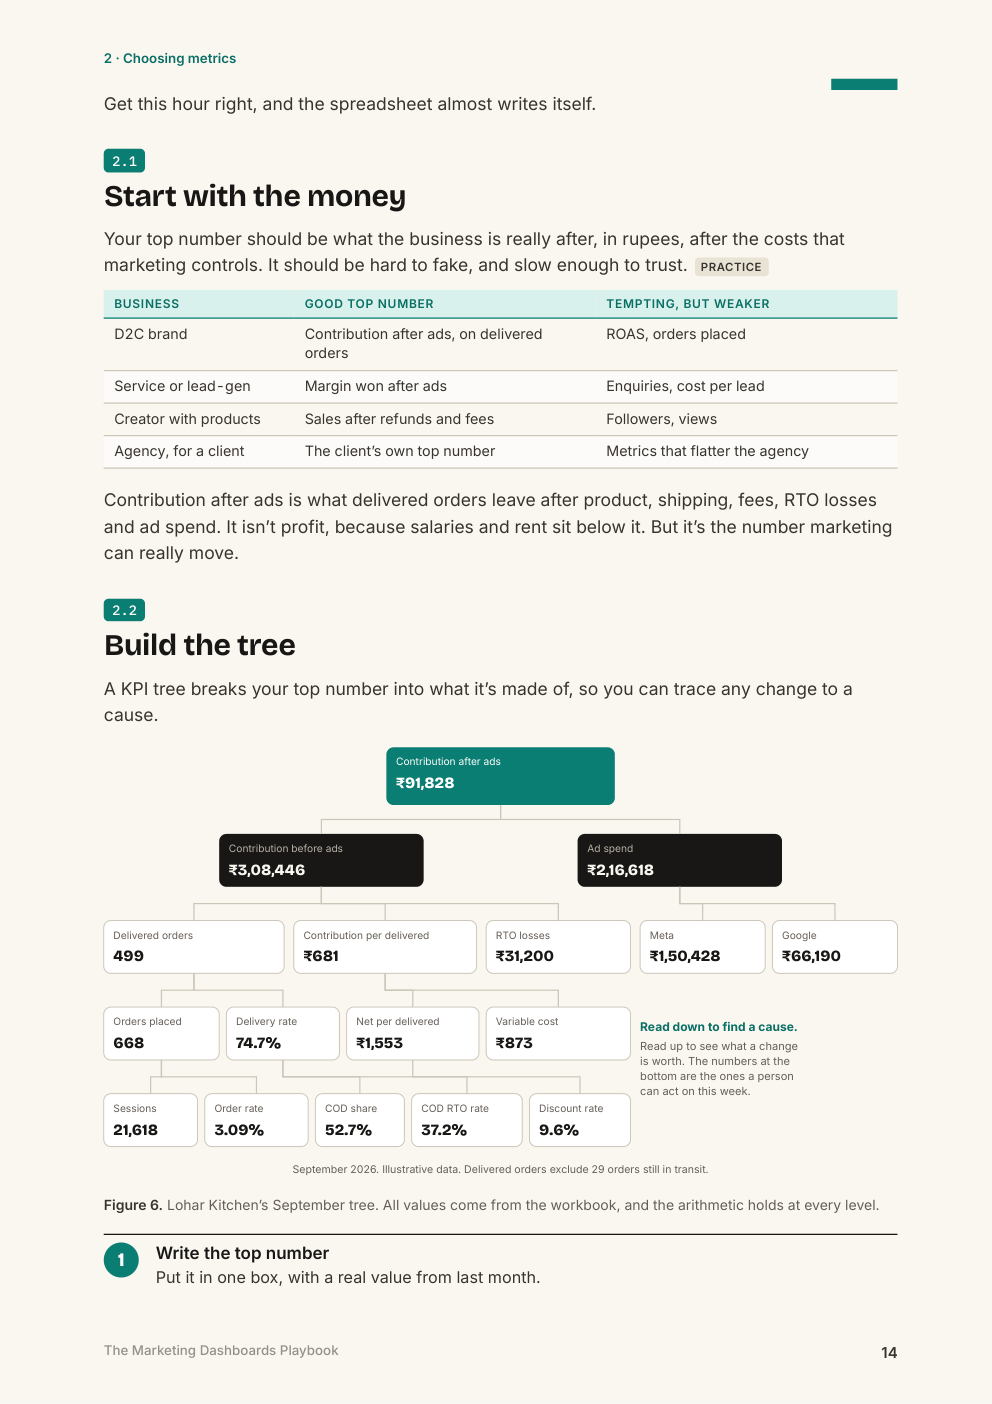
A KPI tree that adds up at every level
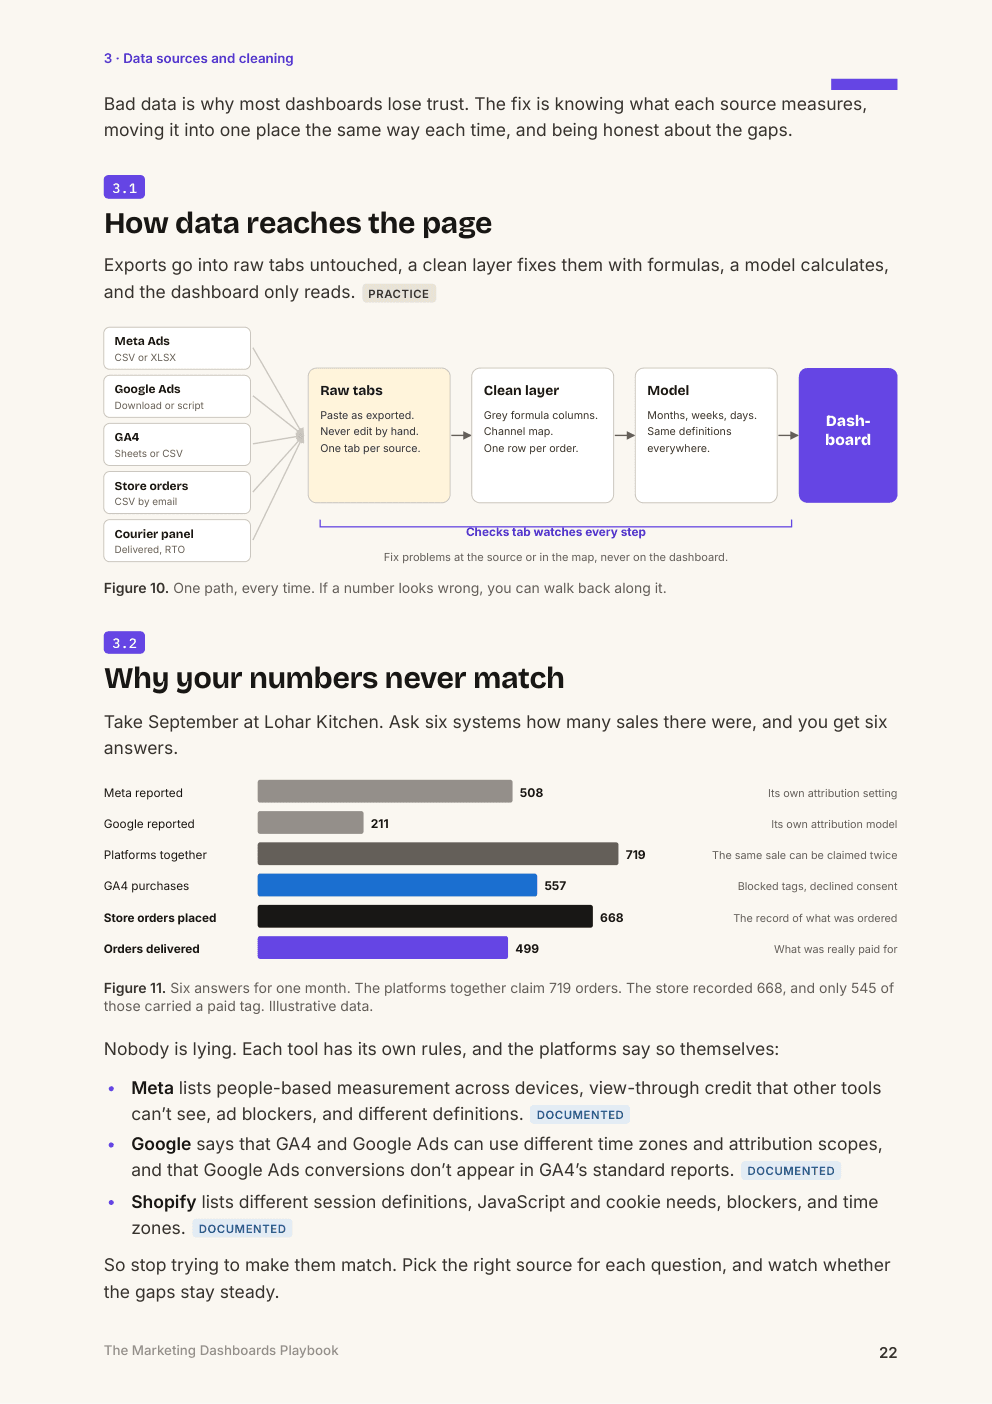
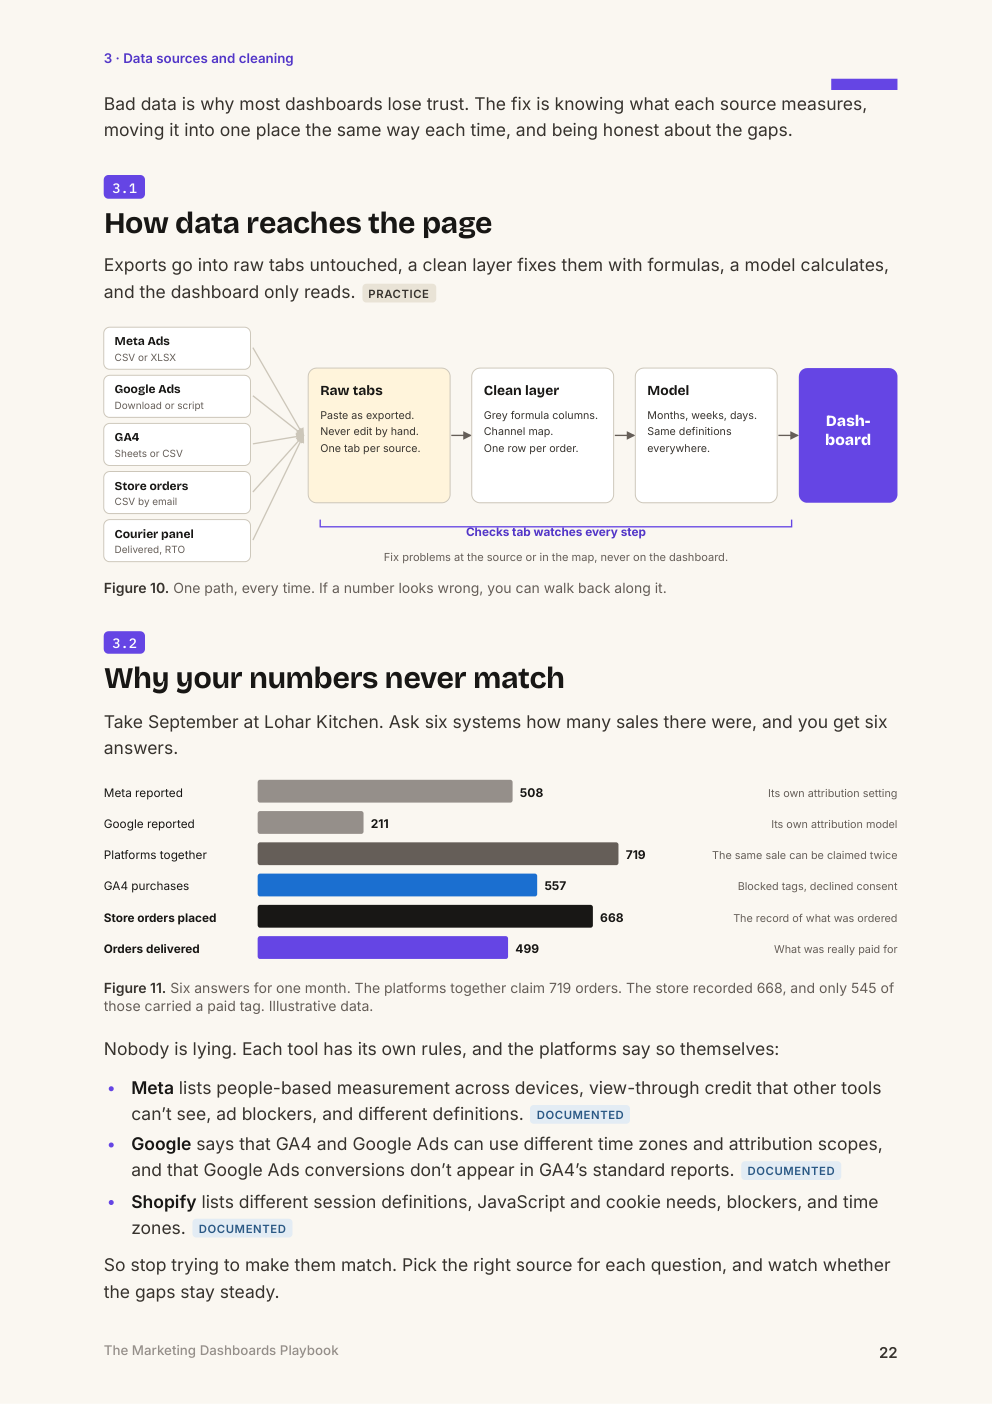
One month, six different order counts
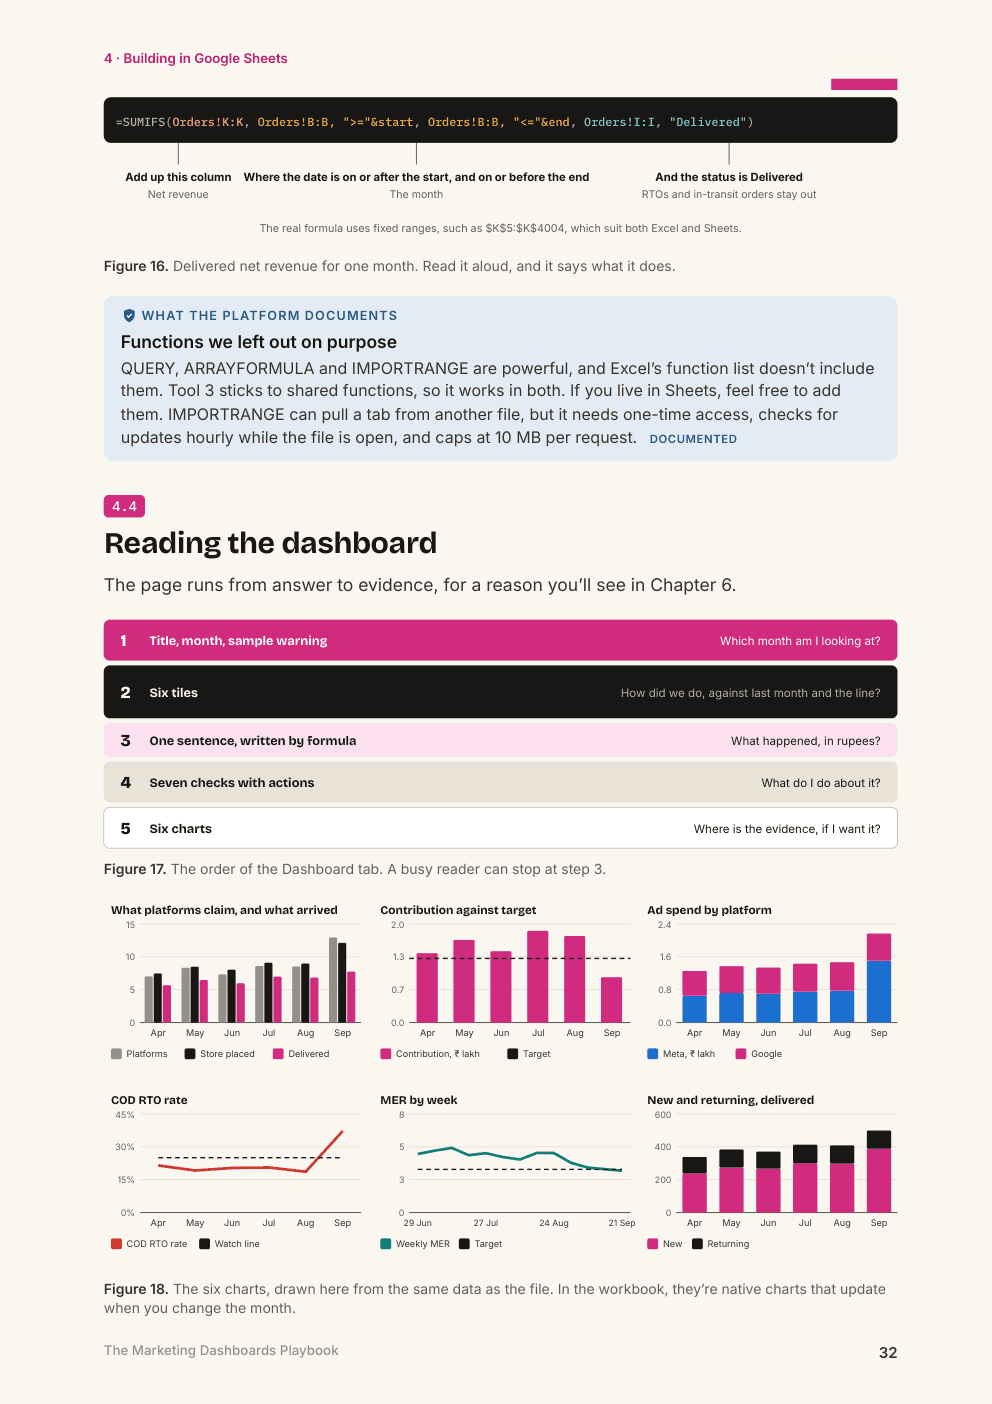
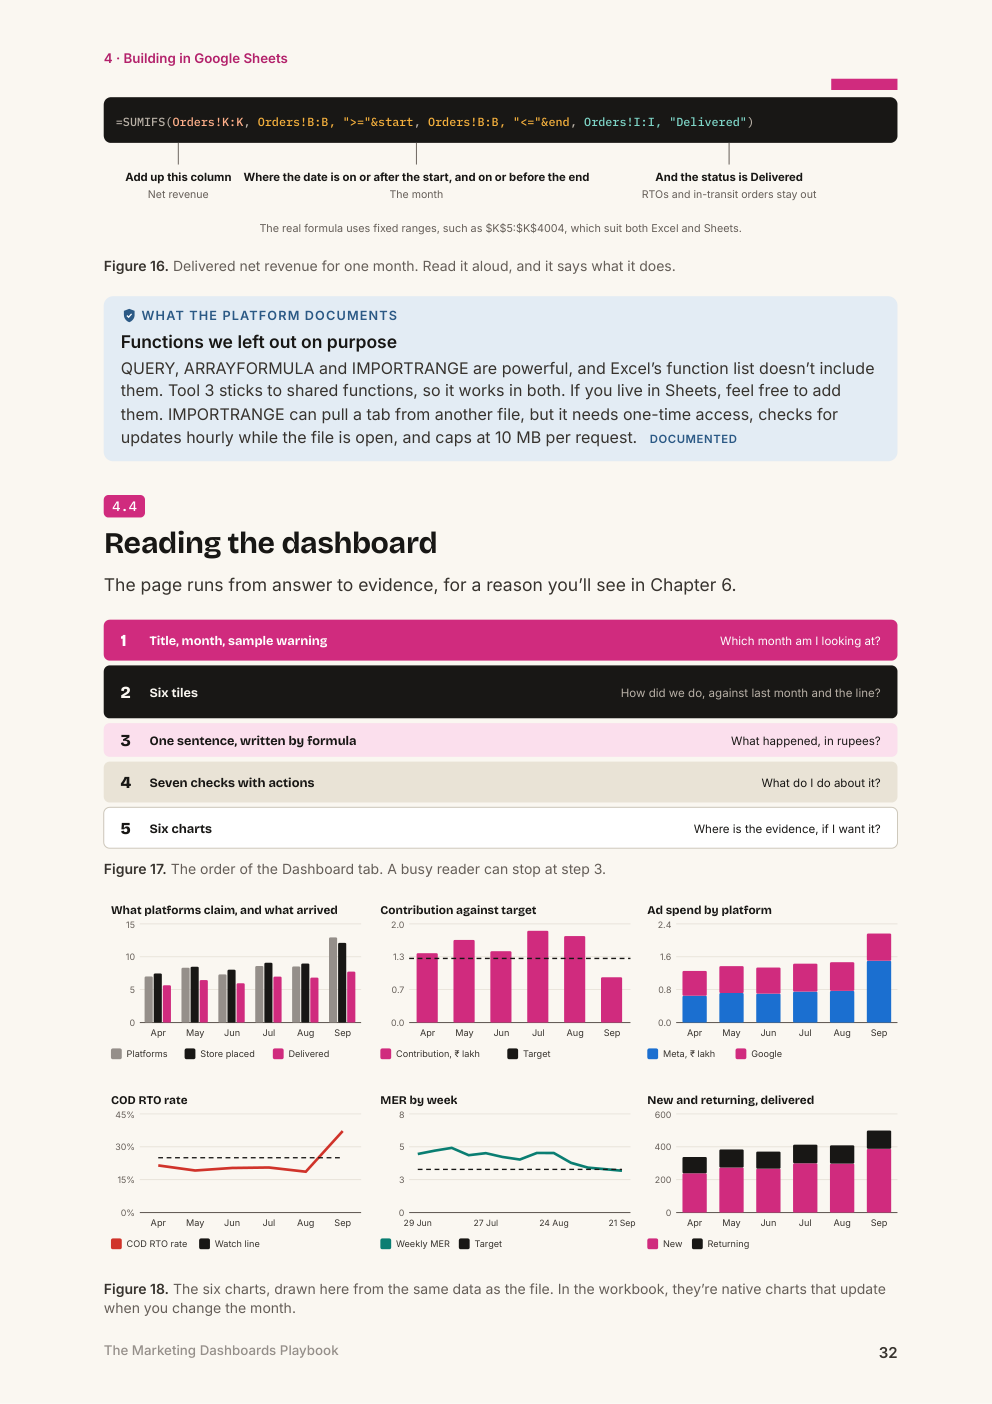
The six charts in the working dashboard
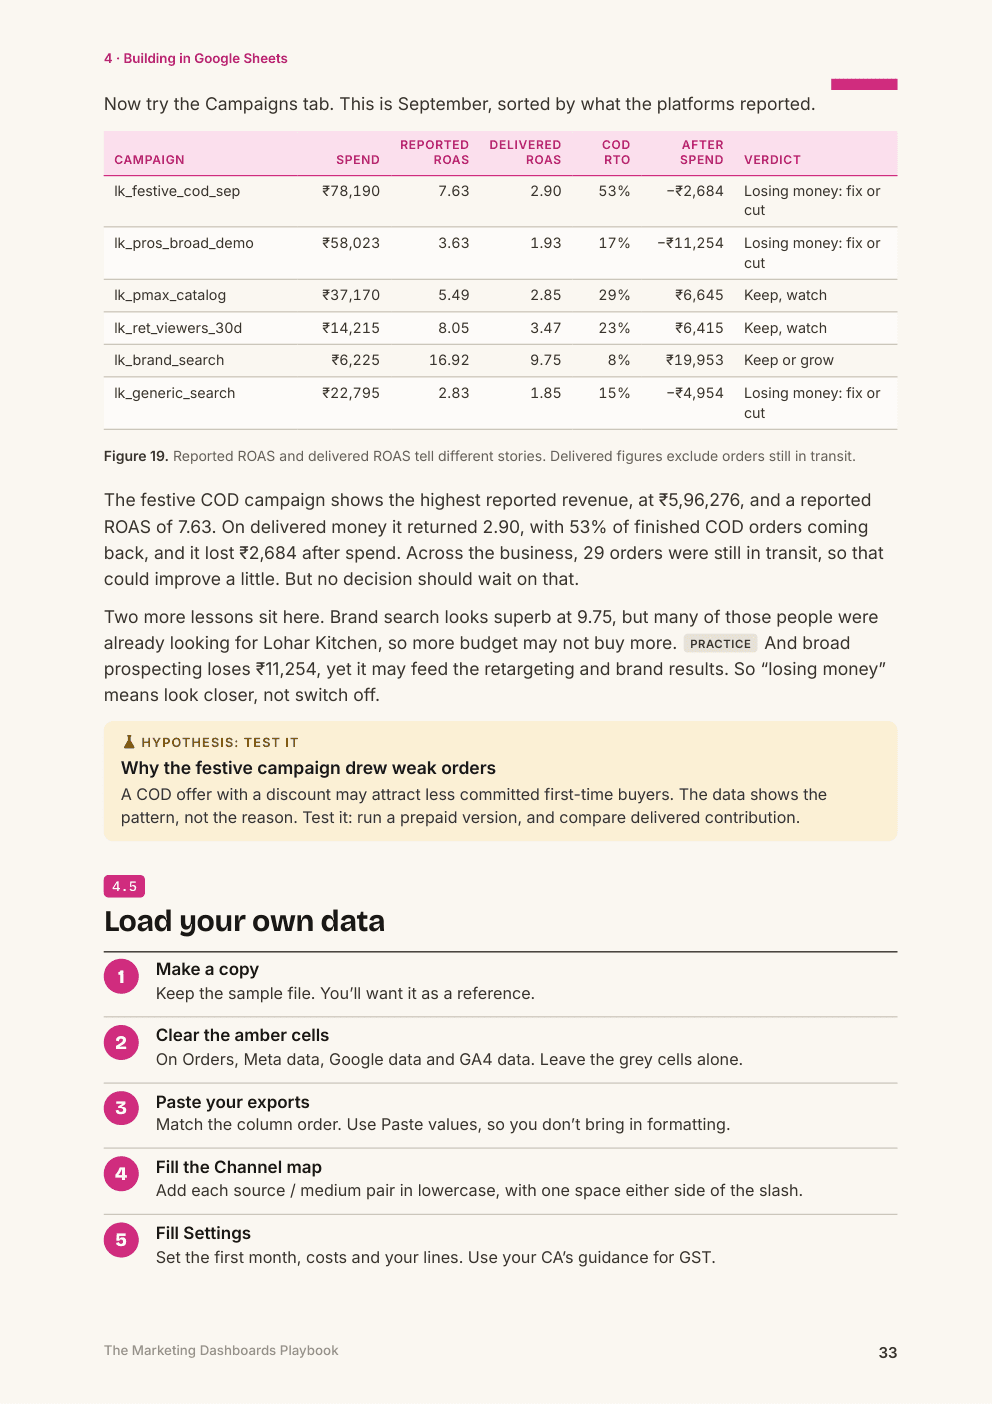
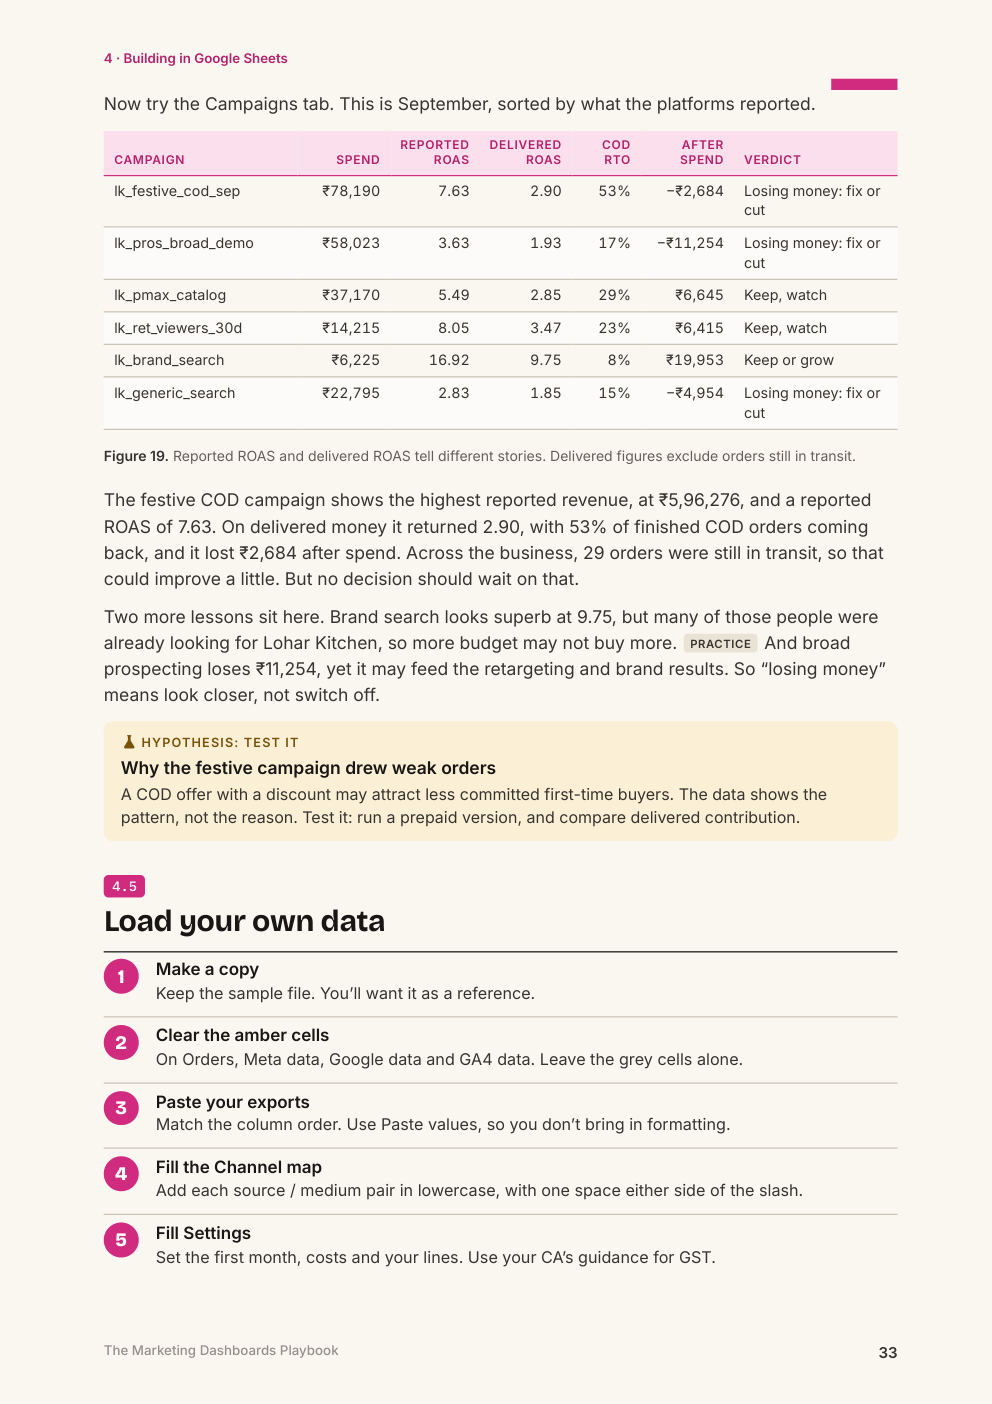
Campaigns judged on delivered money
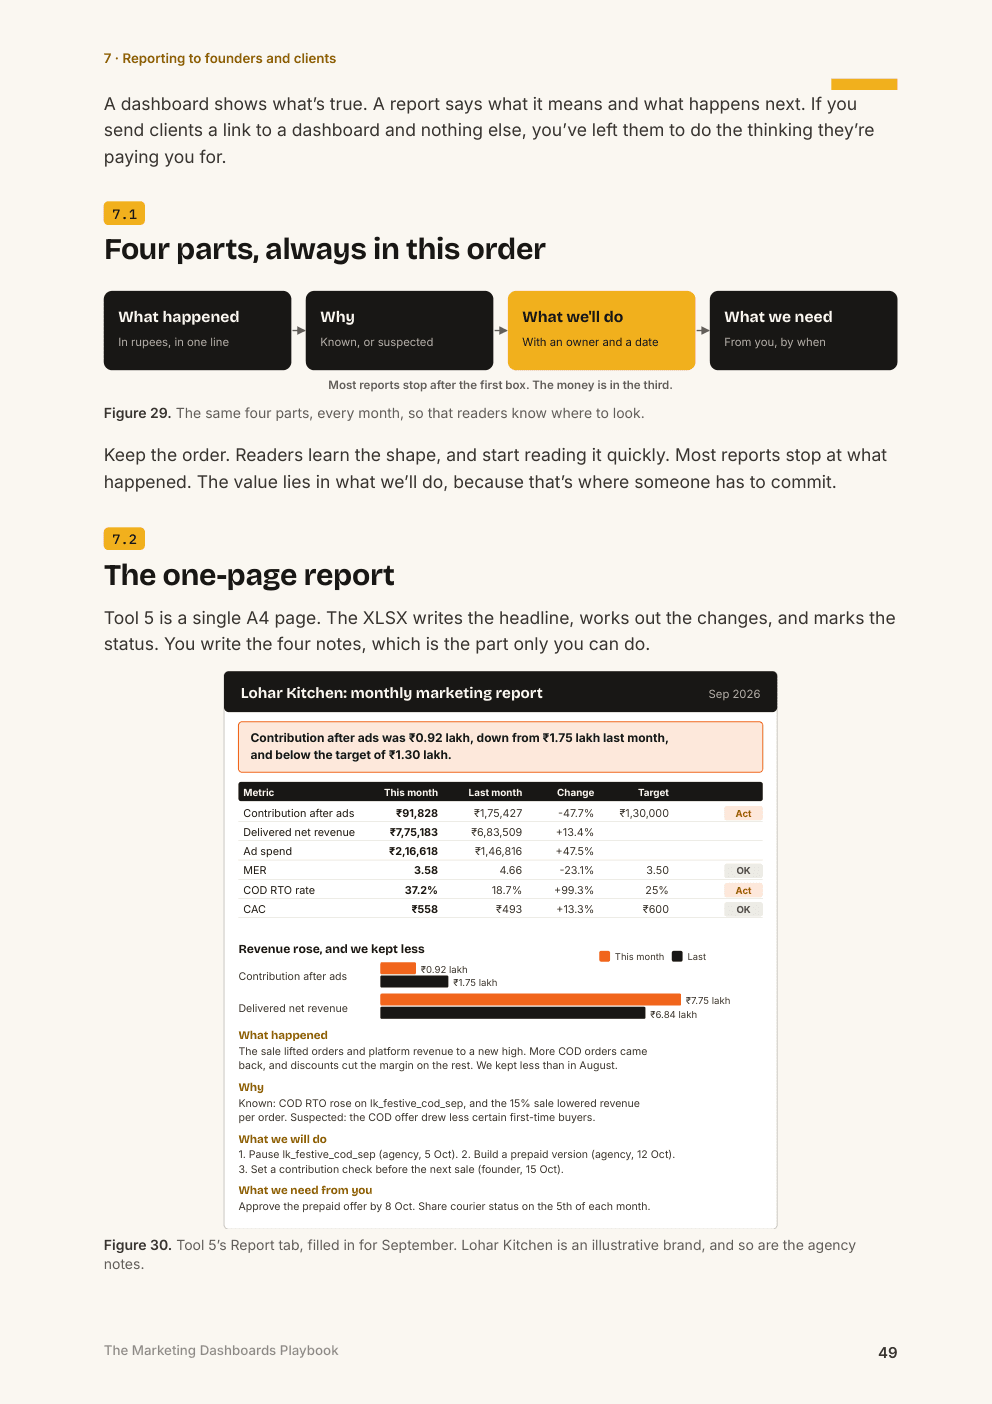
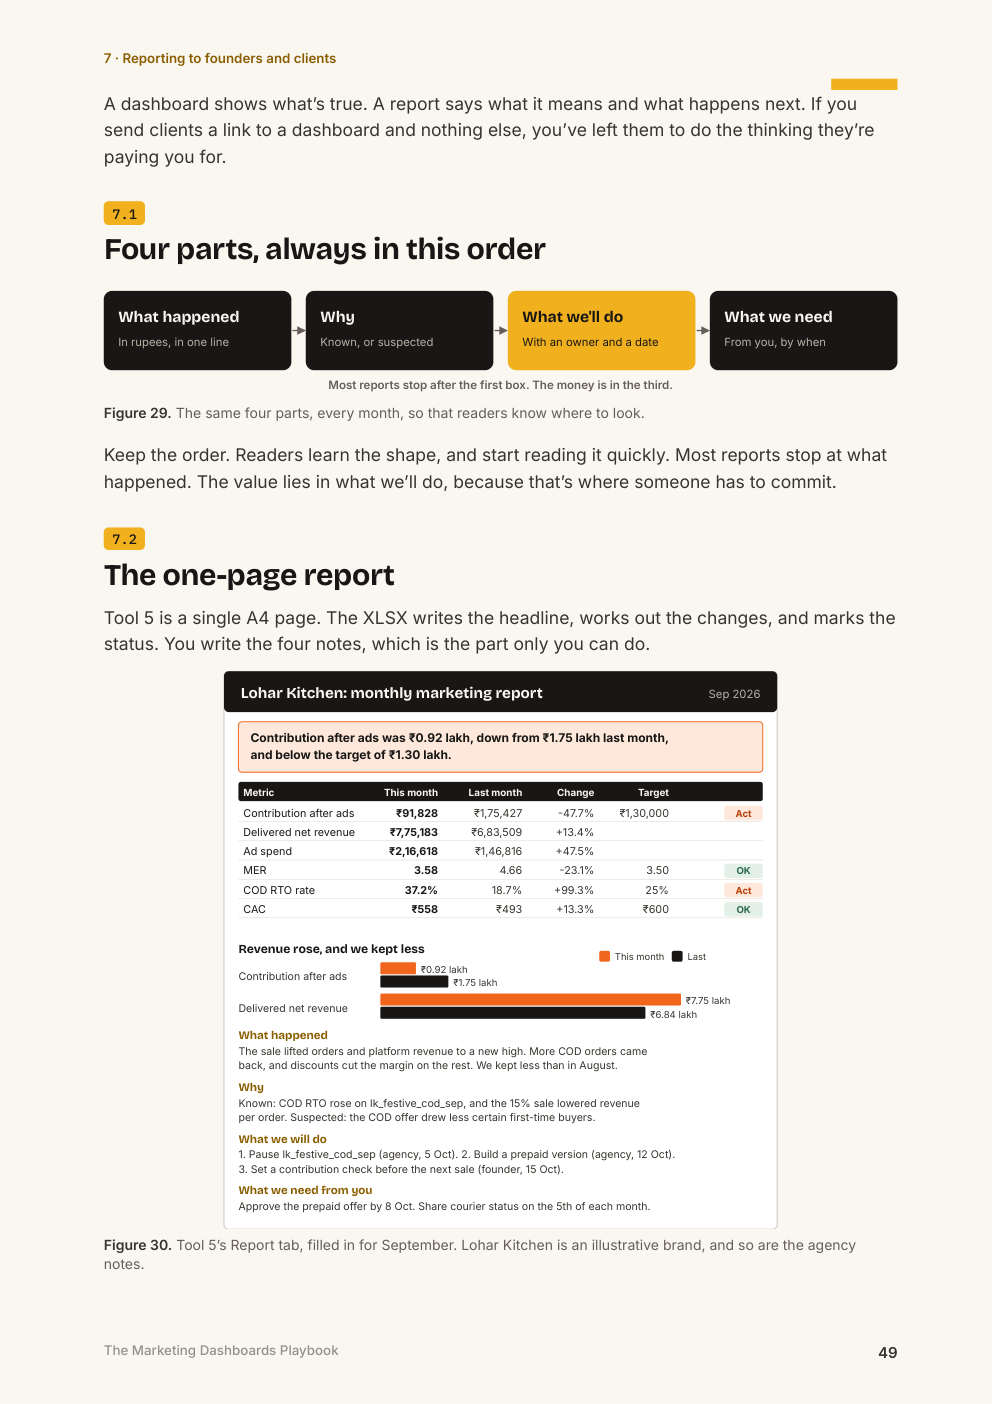
A one-page client report, filled in
Curriculum
69 pages, 8 chapters
1Why Dashboards FailWhat a report does, what a dashboard does, and when you need neither.
- Five ways dashboards fail
- The decision chain
- Why placed orders are not sales
2Choosing Metrics with a KPI TreeFind the few numbers that explain the business.
- A top number in rupees
- Ranking your levers
- Setting lines from your own history
3Data Sources and CleaningWhat each source can and can't tell you.
- Why numbers never match
- Exports from GA4, Meta, Google Ads and Shopify
- UTM rules and cleaning formulas
4Building in Google SheetsA working dashboard on your own data.
- Importing the workbook, and what may need rebuilding
- The five formulas behind every number
- Reading campaigns on delivered money
5Building in Data StudioA shareable report, formerly known as Looker Studio.
- Choosing a data route, and what connectors cost
- Calculated fields and blends
- GA4 quotas, credentials and ownership
6Designing for DecisionsMake the answer obvious in ten seconds.
- Choosing a chart by the question
- Three chart makeovers
- The phone test
7Reporting to Founders and ClientsOne page that gets a decision.
- Four parts, always in this order
- Known or suspected
- Bad news and the numbers question
8Maintenance and Your 30-Day PlanKeep it true, and hand it over safely.
- Weekly and monthly routines
- What to automate, and in what order
- A 30-day plan and 12 prompts
How you get it
- Create an account, and pay securely.
- Your product appears in your library straight away.
- Download the files, and return any time for updated editions.
Edition and updates
Edition 1.0, November 2026, released 7 Nov 2026.
Platform details verified on 1 Nov 2026. The guide lists its sources, and what we couldn't verify.
Questions
Is this software?
No. It's a guide with templates. You run the files in your own Excel or Google account, and nothing connects to your accounts automatically.
Do I need paid connectors?
No. The main route uses exports you already have. The guide explains when a connector is worth paying for, with prices we saw on vendor pages. None showed a rupee price, so check before you buy.
Does it work in Google Sheets?
The formulas use functions shared by Excel and Sheets. The charts are native Excel charts, and Google makes no promise that charts survive import. We haven't tested the file in a live Google account, so check each one after import. A Chart recipes tab tells you how to rebuild any chart.
Is Data Studio the same as Looker Studio?
Yes. Google renamed it in April 2026. The guide uses the new name, and many tutorials still use the old one.
Does it work if I don't sell through Shopify?
Yes, if you can export orders and delivery status. Shopify is the worked example. The tree also has a lead-generation version for service businesses.
Are the examples realistic?
Yes. They work through what small Indian businesses deal with every month: Meta, Google, GA4 and the store all showing different numbers, and orders that look good until courier status comes in. Lohar Kitchen, Studio Aangan and their numbers are illustrative, so use your own figures, not theirs.
Is this up to date?
Platform details were checked on official pages on 1 November 2026, and the sources chapter lists what we could not verify. Corrections and new editions appear in your library.
How will I get it?
After payment, the product appears in your library. Download the guide and tools at any time, and return for updated editions.
Marketing Dashboards
₹999, one-time payment.
You might also want
Template Bundle
The Complete Library
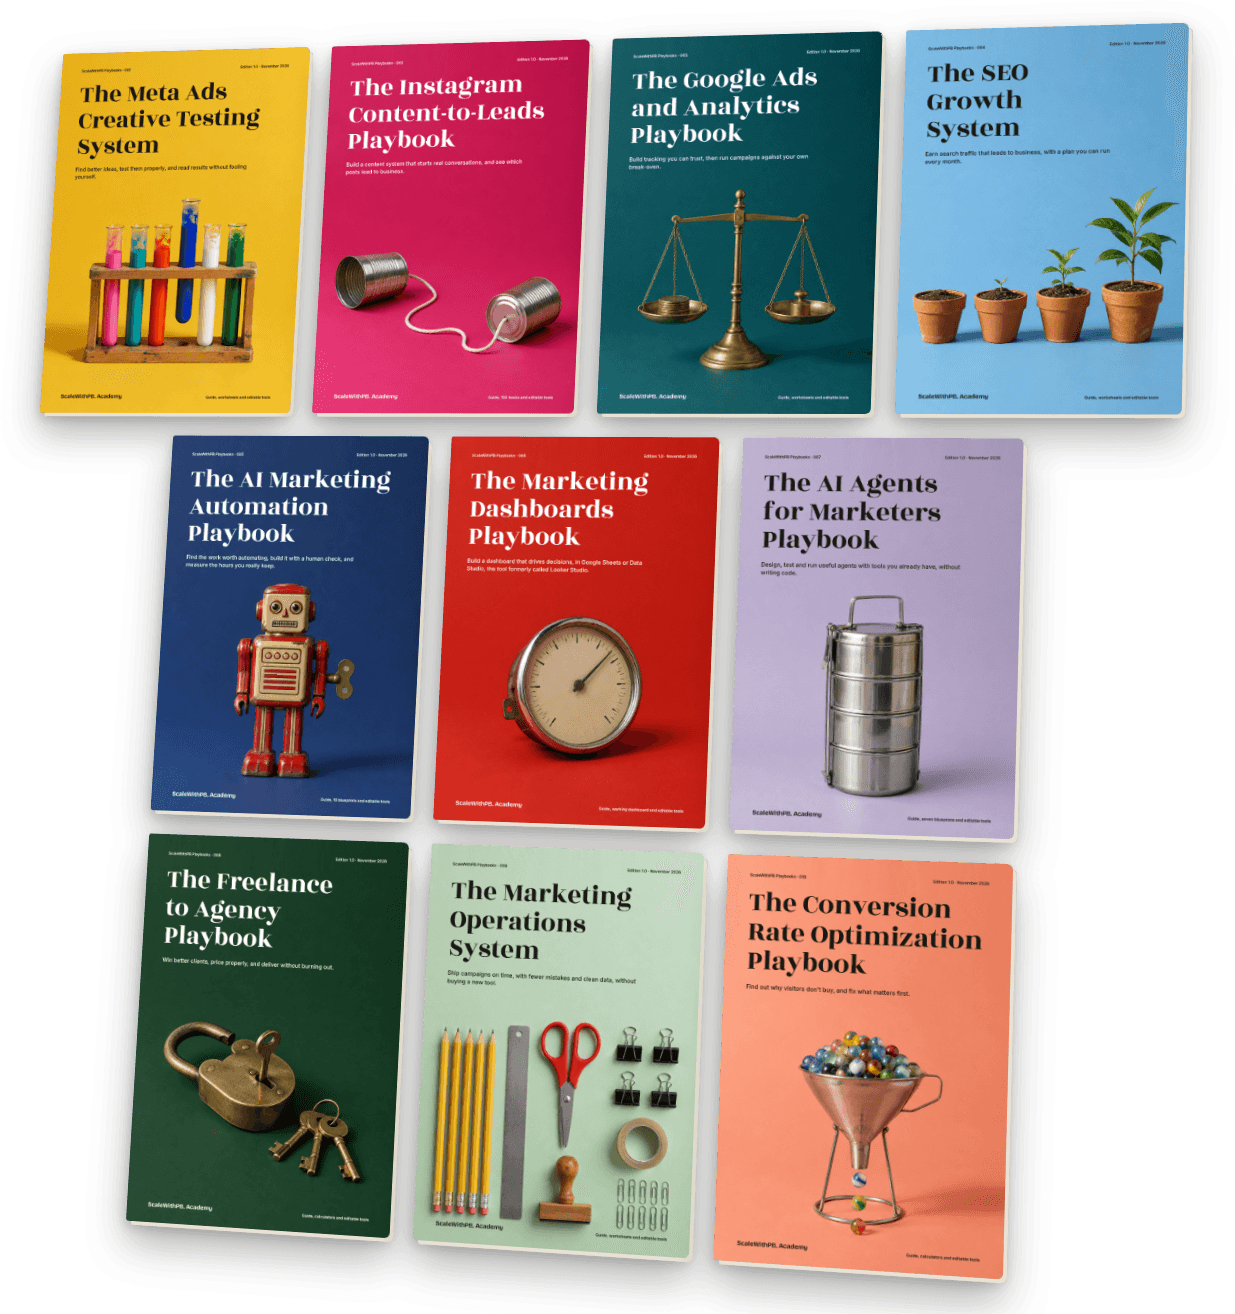
All ten playbooks, with every spreadsheet and prompt pack.
Crossed-out price ₹9,990 Price now ₹4,999
Template Bundle
The Client Work Bundle
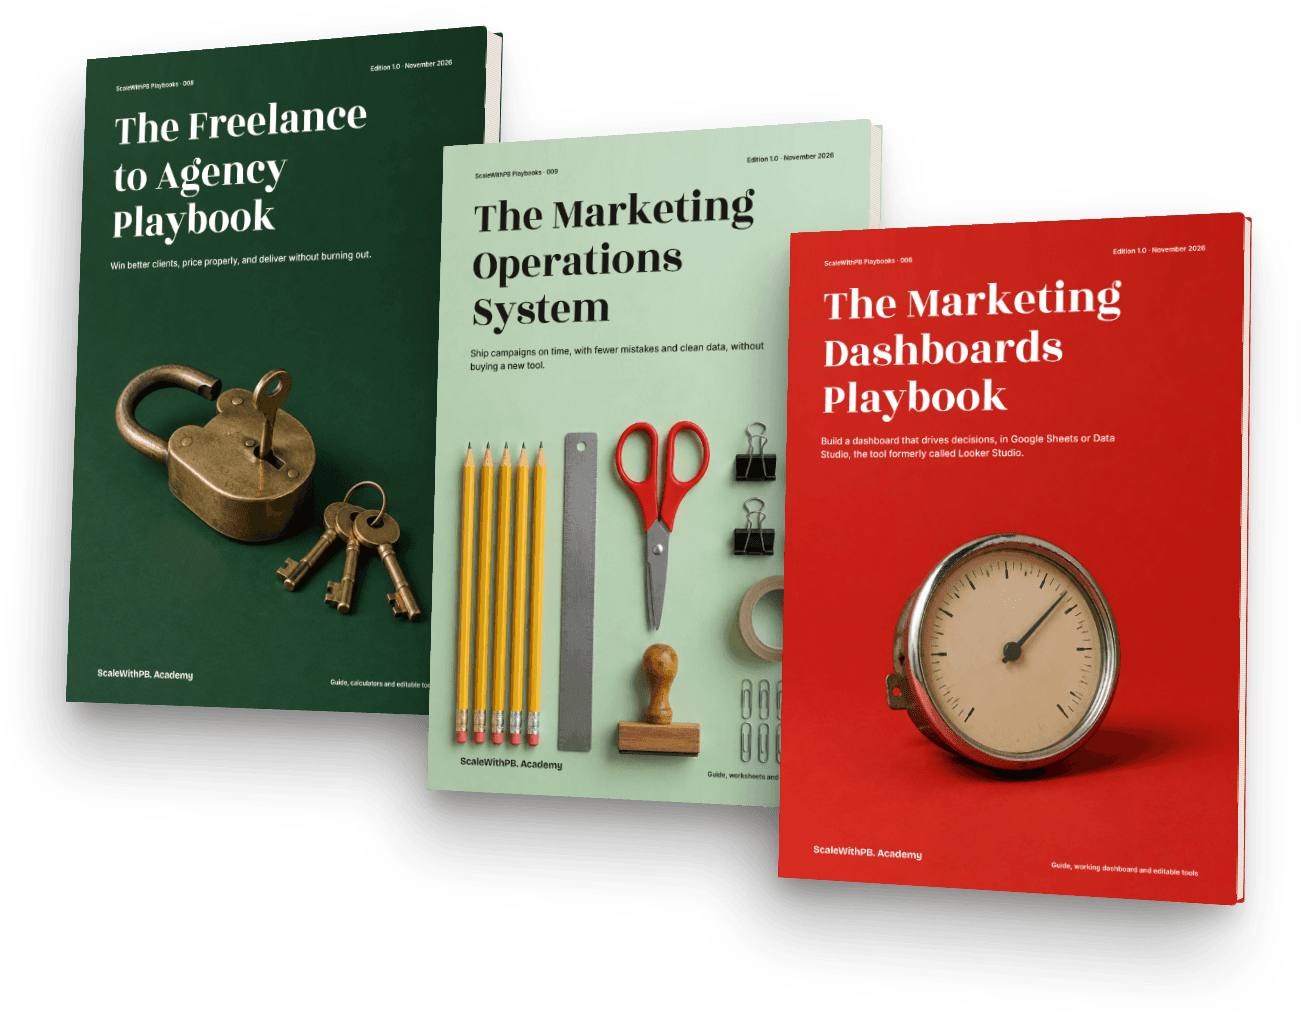
Pricing and winning clients, running work on time, and reporting that drives decisions.
Crossed-out price ₹2,997 Price now ₹1,999

PDF Playbook
The AI Marketing Automation Playbook
A 68-page guide with 10 workflow blueprints, 25 prompts and working spreadsheets, including WhatsApp and consent rules for India.
₹999